Tableau Tips: How to zoom in images
You must have probably seen this on websites. A bunch of images present and when you click on one, it expands or zooms in.
When I was working on my “Forbes 100 Women of the year 2020” viz, I wanted to add in this feature to expand the image of the selected woman.

I’ll be walking through the steps to build the view. So let’s jump it!
For sake of simplicity, I’ll be using the superstore dataset.
The first thing would be to create the grid-like structure (small multiple) that I have above.
Ryan Sleeper’s blog on “How to Make Trellis / Tile / Small Multiple Maps in Tableau” has been my go-to guide to create small multiple charts

Let’s take the Top 100 Customer Names by Sales

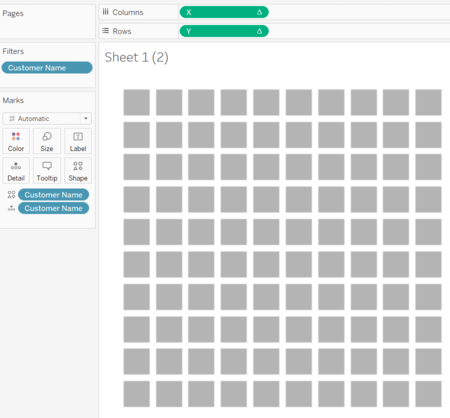
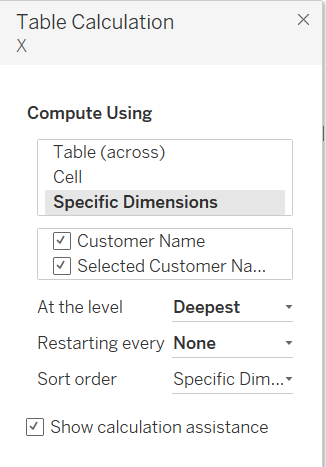
Don’t forget to compute X and Y calculation by “Customer Name”
The base is ready! Now it’s time for topping ..uh no, sorry got distracted by the pizza. :D
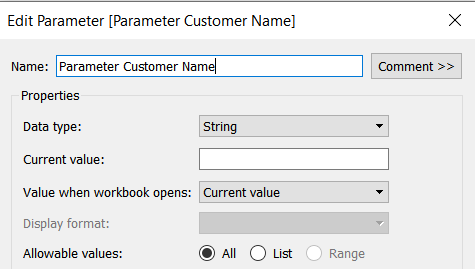
To expand a box we’ll need to select the box/customer name using a parameter along with parameter action.

Now add this new calculated field [Selected Customer Name] in Size and Color. Increase the size of True as per your liking.
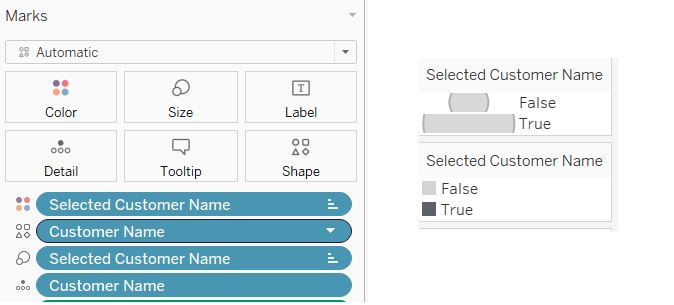
Once you add this, your view will get disrupted. You need to change the compute by to the Customer Name and Selected Customer Name.
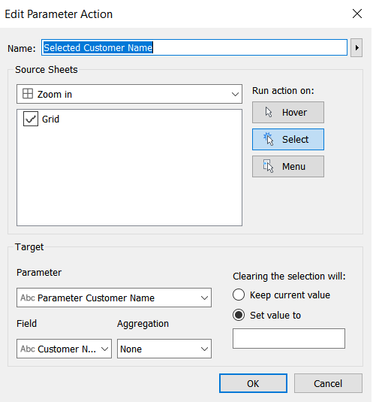
Now create a parameter action on the dashboard to capture the customer name -
Almost there!

But there is one little problem. When I select any of the corner block, the arrangement change.
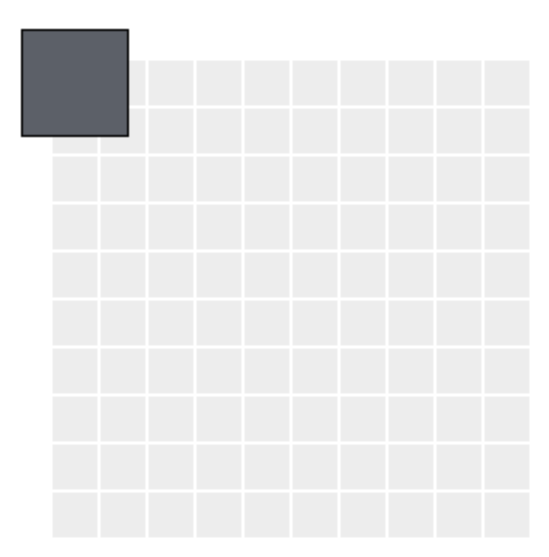
So how do we keep it static? Well, a few more steps to have that fixed.
I need to add some whitespace on the ends beforehand.
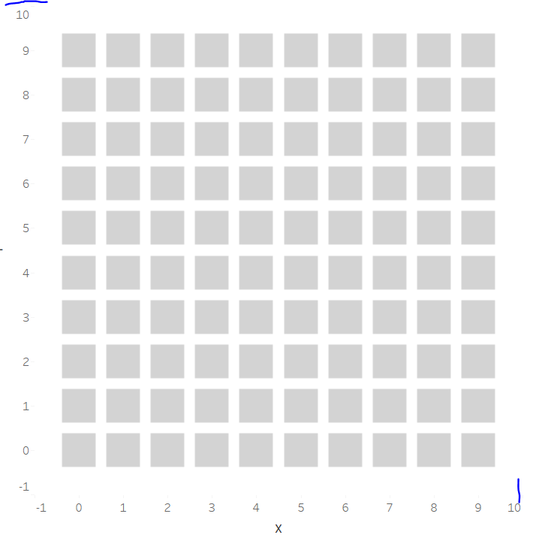
This can be done in two ways
- Manually increase the axis stare and endpoint on both the X and Y-axis. This could be a trial and error process, I have added a +1 and -1 but this can vary at times.
- Make it Dynamic (which is what I prefer). The logic here is to get the maximum of X and Y and add a minimum of +1 and -1.

Create these 4 calculations. This will help us in getting the Min and Max of X and Y and add some whitespace on the corners.
If you’re not clear on how WINDOW_MAX and WINDOW_MIN works, WINDOW_MAX returns the maximum of the expression within the window. WINDOW_MIN returns the minimum of the expression within the window. To know more, refer to the Tableau Window Function page.
Are you still with me? I promise we’re almost there :)
Firstly, drag these 4 new fields on your marks card.
Add reference lines on X and Y-axis -
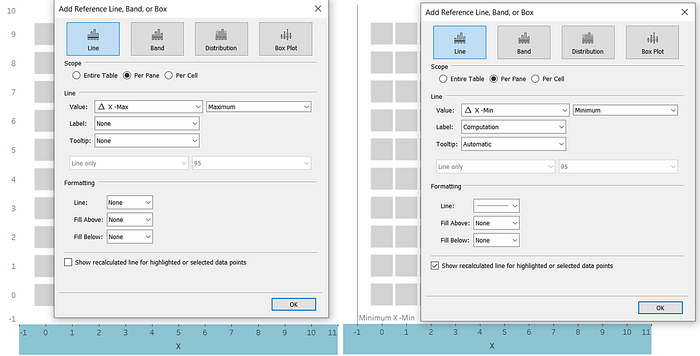
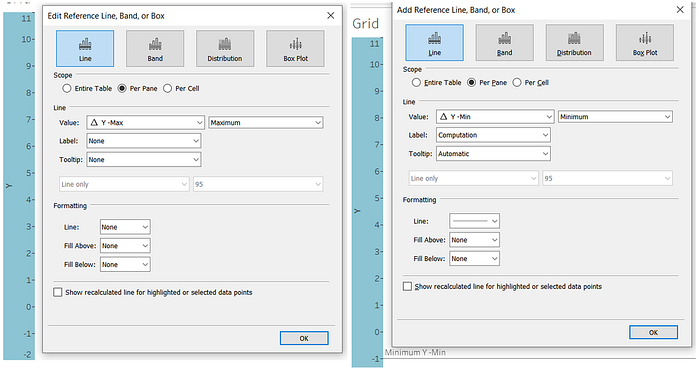
I have left the line visible just to show how it works. But you can hide the line, label, and tooltip to make it look presentable.
You’ll need to reduce the size of the shape a little bit since the axis has been increased.
And now if you go back to your dashboard (where the action is applied), you’ll see how the shape is now static.
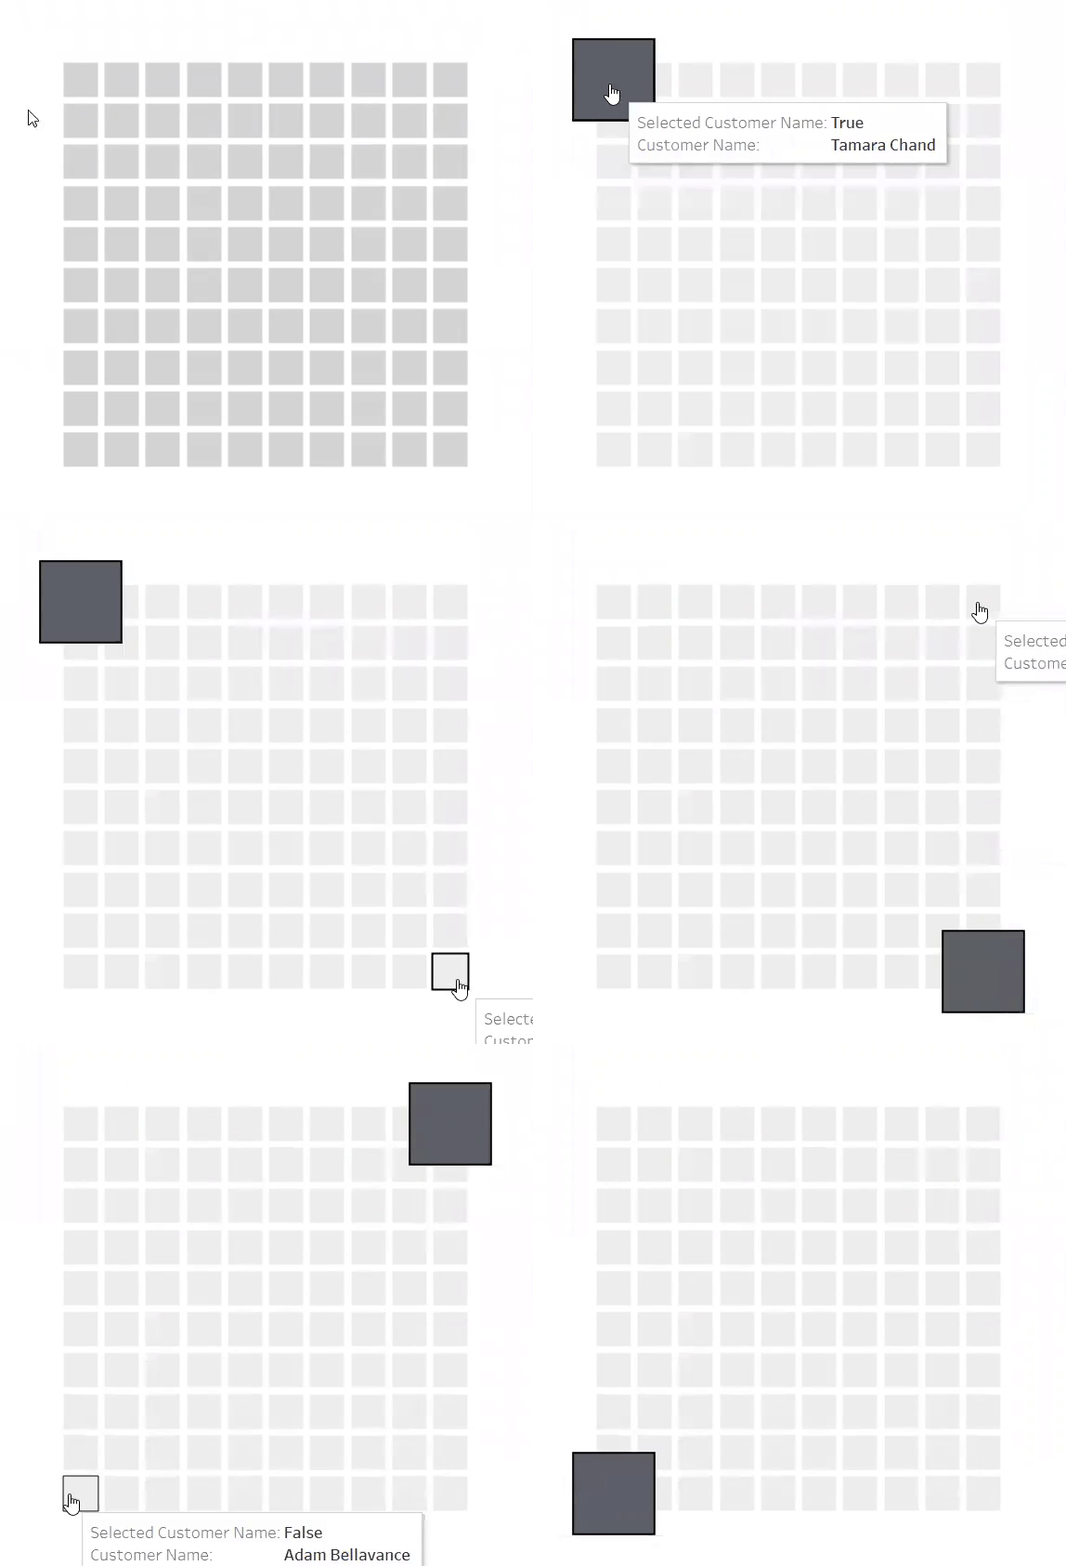
Voila! That was long, right? I hope it was worth it and you learned something new :)
If you want to stop the default highlight by tableau, there is an amazing trick that can be used- https://www.thedataschool.co.uk/brandon-fitz-gerald/how-to-stop-highlighting-when-selecting-a-mark-tableau-tip
You can even find this workbook on my Tableau Public Page:
#HowToViz: Zoom in shape — Priyanka Dobhal | Tableau Public
Feel free to download and try it yourself.
Did this help you? Would love to hear from you.
Thanks for the read :)


