Bring Passion into your Visualization
If you’re into data visualization in your job, you probably get tired of the same work as me. Don’t get me wrong, I love my work. But you know, sometimes the data is not exactly the kind that excites me. And I’m someone who values the data over the visualization.
So how to keep the fun alive? Bring that passion and fun into your personal visualization. At work, you have your data ready for you. But here you can get your own data and tell your own story.
An overwhelming start? ok let’s slow down.
Step 1: Find your passion
Ok so no, I’m not asking you go into a Zen Mode for this. When I say passion, I mean something you enjoy. Anything that makes you happy!
So let me give you an example. When I’m not working, I’m listening to some music or watching a movie. During tennis season, I’m glued to the TV to cheer for my favorites. I’m also into reading crime, thriller, mystery and horror novels.
So when I’m looking for an idea for a passion project, these are the topics that I look for. Think about you favorite thing and let’s look for the data.
Need some examples?
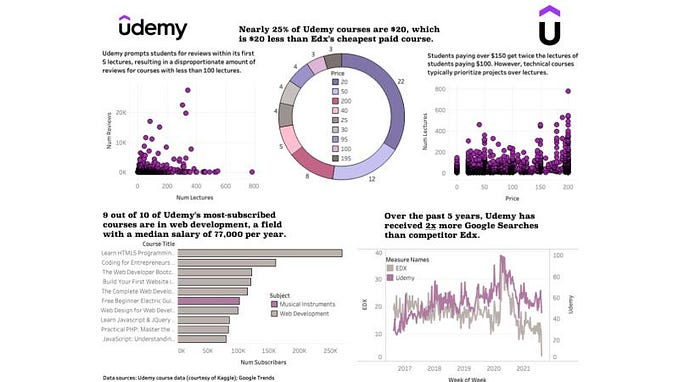
Fan of Marvel? How about a viz on that

Or TV shows?

Or maybe talk about some amazing women?

My intension was to show how diverse your topic could be and not a way to show off my work :)
Step 2: Look for data
Now this is the tricky part. There are a few websites with data readily available.
- The Sample Tab in Resources — Tableau has collected a variety of datasets to help you get started https://public.tableau.com/en-us/s/resources
- Kaggle: https://www.kaggle.com/datasets
- Data.World: https://data.world/
- Fivethirtyeight on Github: https://github.com/fivethirtyeight/data
- Information is Beautiful: https://www.informationisbeautiful.net/data/
- BuzzFeed News on Github: https://github.com/BuzzFeedNews/everything
- MakeoverMonday (Community Project): https://www.makeovermonday.co.uk/data/
- Try Searching a topic on Dataset Search: https://datasetsearch.research.google.com/
But what if the data isn’t readily available? Don’t give up because there is still a way. Internet is filled with data and sometimes we have to get that out. Now let’s talk about how we can do that.
- Manually extract it by copy paste
- Many websites have APIs that can be used to pull data from it
- Learn how to fetch data using python: https://www.youtube.com/watch?v=pxofwuWTs7c - Web-scrape using languages like python, R etc. can be used to get the information
- I’m personally more comfortable with python so here’s a good video explaining it: https://www.youtube.com/watch?v=XVv6mJpFOb0
- If it helps to have a walkthrough of my process, I had a session with Her Data on Web Scraping: https://www.herdata.net/post/her-data-learns-webscraping-101
What if you have an idea that is not completely available on internet either? These are my kind of projects :) I love creating datasets manually. Recently, I was so inspired to look at the numerous Cinderella movie adaptions and see how different they were.
I spent weeks on watching the movies and noting down information about it. It was a long process but finishing it was the best feeling ever.
Here is the dataset that I created: https://data.world/priyankad0993/movies-based-on-cinderella
Step 3: Find a story
This is my favorite part. Usually, I get very engrossed in researching about the topic.
In this step, you need to narrow down the questions that you are answering through your story. For example, when I was working trough the visual process of building out the below viz. In this movie, a family navigates their lives in silence to avoid mysterious creatures that hunt by sound. So obviously there weren’t a lot of words spoken out loud. I was curious to know how many dialogues where spoken and who spoke them.

So when you start building out the story, start with What do you want to show and Why do you want to show that. Once you have clarity, the next step would get easier.
Step 4: Build it out
Now I would suggest you to break this part into two stages
- Create a wireframe: You could just draw it out on a piece of paper or use software like Power Point, Figma, Adobe etc.
- Learn from Judit Bekker: https://www.youtube.com/watch?v=OywYYW4clCU&t=1353s - Once you know how it should look like, jump into the visual tool you’re using and bring in your data.
Voila! That’s all it takes. You are all set.
Does it feel good to work on something out of your interest? Or was it too much? Would love to hear from you in the comments section or feel free to connect with me on other platforms.
Hope you’re Staying Safe and Healthy.


